 |
| Heat Genius Chart |
 |
| British Gas Hive Chart |
At this stage I am not sure how useful charts of data collected from my central heating system are going to be, but I was keen to learn some new skills. This is a record of my experimenting so far. I plan to add more posts as it develops.
What to log?
There is all sorts of sensor data coming out of my system but the things I am most interested in are:
- actual temperatures of rooms v desired temperatures over time
- how often the system is calling for heat
- external temperature over time
- actual boiler on/off status
The first three are easily available within my ZWay module. The 4th, the actual boiler status (ie whether it is running) is not available but I have an idea as to how I might measure it using an arduino - but that is a project for another day.
How to log?
The ZWay system already provides a module called SensorValueLogging and from the UI you can easily setup a log to a file or to an external service:

The choices of what to log are limited to actual sensors in the system so it isn't quite what I want. However, it was going to be a good starting point and the code that does it would be very simple to adapt for my own code. But how does it work?
Logging to a file
I activated the module to log the value of one of my thermostats to a JSONFile. The module binds to the value of the thermostat and logs every value change via this piece of code:
var storedLog = loadObject("SensorValueLogging_" + vDev.id + "_" + self.id);
if (!storedLog) {
storedLog = {
deviceId: vDev.id,
deviceName: vDev.get("metrics:title"),
sensorData: []
};
}
storedLog.sensorData.push({"time": Date.now(), "value": vDev.get("metrics:level")});
saveObject("SensorValueLogging_" + vDev.id + "_" + self.id, storedLog);
if (!storedLog) {
storedLog = {
deviceId: vDev.id,
deviceName: vDev.get("metrics:title"),
sensorData: []
};
}
storedLog.sensorData.push({"time": Date.now(), "value": vDev.get("metrics:level")});
saveObject("SensorValueLogging_" + vDev.id + "_" + self.id, storedLog);
This resulted in a SensorValueLogging json file appearing in the storage directory of my ZWay server:

inside I could see a JSON object containing {timestamp, value} pairs for my thermostat:
inside I could see a JSON object containing {timestamp, value} pairs for my thermostat:
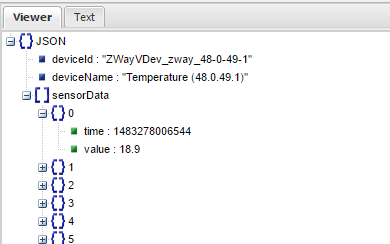 |
| sensor data displayed via http://jsonviewer.stack.hu/ |
I could certainly mimic this operation in my own code but was a little puzzled by how loadObject() and saveObject() resulted in such strange file names. The source code was not easily available so I turned to the zwave forum and this post gave an explanation.

I had a quick look at what MD5 is and was satisfied that all I needed to know was that loadObject() and saveObject() would provide a mechanism for me to store and retrieve collected data locally on my rPi (if that is what I decided to do). Someone on the ZWave forum did this a couple of years ago and also provided some web pages to display the data (via Google Charts).
However, I was more keen to investigate sending the data into the cloud.
Then I came across this page from The Complex and Sustainable Urban Networks (CSUN) Laboratory at the University of Illinois at Chicago. They have been logging temperature and humidity data from an arduino since 2014. The data is logged to a Google Spreadsheet every 10 minutes (via PushingBox) and is then extracted and displayed with Google Charts. Perfect.
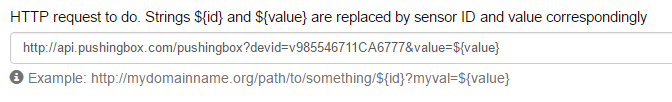
I signed up to PushingBox and reconfigured the SensorValueLogging module to send its readings to PushingBox:
The devid was just that of the demo scenario that is automatically created when you sign up. It was linked to a service that sent an email to me. I adjusted the email to pass on the temperature reading:

As with the JSON file example, SensorValueLogging binds to the value of the Thermostat and logs every change. But for HTTP logging it runs this piece of code:

PushingBox to Google DocsI had a quick look at what MD5 is and was satisfied that all I needed to know was that loadObject() and saveObject() would provide a mechanism for me to store and retrieve collected data locally on my rPi (if that is what I decided to do). Someone on the ZWave forum did this a couple of years ago and also provided some web pages to display the data (via Google Charts).
However, I was more keen to investigate sending the data into the cloud.
Logging to the cloud
A quick google search for cloud data logging services and I was overwhelmed by choice. Obviously most of these are commercial based for huge quantities of server data. Where to begin?Then I came across this page from The Complex and Sustainable Urban Networks (CSUN) Laboratory at the University of Illinois at Chicago. They have been logging temperature and humidity data from an arduino since 2014. The data is logged to a Google Spreadsheet every 10 minutes (via PushingBox) and is then extracted and displayed with Google Charts. Perfect.
I signed up to PushingBox and reconfigured the SensorValueLogging module to send its readings to PushingBox:
if (self.config.logTo === "HTTPGET") {
http.request({
method: 'GET',
url: self.config.url.replace("${id}", vDev.id).replace("${value}", vDev.get('metrics:level'))
});
}
This did indeed end up sending me emails every time the temperature changed in my office:http.request({
method: 'GET',
url: self.config.url.replace("${id}", vDev.id).replace("${value}", vDev.get('metrics:level'))
});
}
Next step was to push the data to a Google Spreadsheet rather than to an email account.
I used this excellent instructables guide to help me through. The interface has changed a bit since that was written but the steps are all valid. Essentially I needed to make PushingBox mimic what happens when data is submitted via a Google Form to a Google Spreadsheet. So, I started by creating a form and submitting some data.
- Create a google form here with a single question and a short text answer.
- Link the form to a spreadsheet (either existing or a new one) and make the spreadsheet shareable
- Click on SEND and choose the 'send via link' option.
- Copy the URL and paste it into a new browser window
- Submit a temperature reading via the form
In my case, it sent the following when I submitted a value of 5.
The URL is the same as the one you see after pressing submit - the one that the Instructables guide asks you to copy.
POST https://docs.google.com/forms/d/e/1FAIpQLSdewH0LtfKOpCDqL_Ydi76dUYxrsZs41YDAHszyuvBstApP4g/formResponse HTTP/1.1
with
entry.463855442=5&fvv=1&draftResponse=%5B%2C%2C%227319728817704999679%22%5D%0D%0A&pageHistory=0&fbzx=7319728817704999679
in the body.
I set up a PushingBox service to attempt to do the same thing:

The full URL can be seen here.

I then added this service to the original demo scenario with the entry data from the body I had captured in Fiddler. $value$ is used to tell PushingBox to substitute the actual value given to it from the ZWay SensorValueLogging module. The rest of the data I had captured in the body I ignored.

And here are the resulting entries in my spreadsheet:

Which I then displayed via google charts thanks to a quick bit of hacking of the CSUN HTML and javascript.

Next step will be to write my own logging object / module and start collecting all of the data I require.
No comments:
Post a Comment